Interactive projections with more than 10,000 proprietary metrics on emerging trends, market changes, and consumer behavior–with a less than 2.4 percentage point variation in estimates vs. actuals.
We build our forecasts using unbiased data to create estimates and projections that assess the size or direction of digital topics, markets and consumer behavior. This process enables us to create thousands of forward-looking estimates with near pinpoint accuracy.
| Time Period | Geography | Metric | Our Forecast | Actual | Delta |
|---|---|---|---|---|---|
| Q2 2026 | Worldwide | Google Search and Other Growth | 16.10% | 16.80% | +0.7ppt |
| Q2 2026 | Worldwide | Google Total Advertising Growth | 13.20% | 14.40% | +1.2ppt |
| Q2 2026 | Worldwide | Amazon 3P Revenue Growth | 16.30% | 15.90% | -0.4ppt |
| Q2 2026 | Europe | Meta Ad Revenue Growth | 23.90% | 24.10% | +0.2ppt |
| Q2 2026 | US | Walmart Inc. US Net Sales Growth | 4.0% | 4.40% | +0.4ppt |
| Q2 2026 | US | Target Total Retail Sales Growth | 4.30% | 5.00% | +0.7ppt |
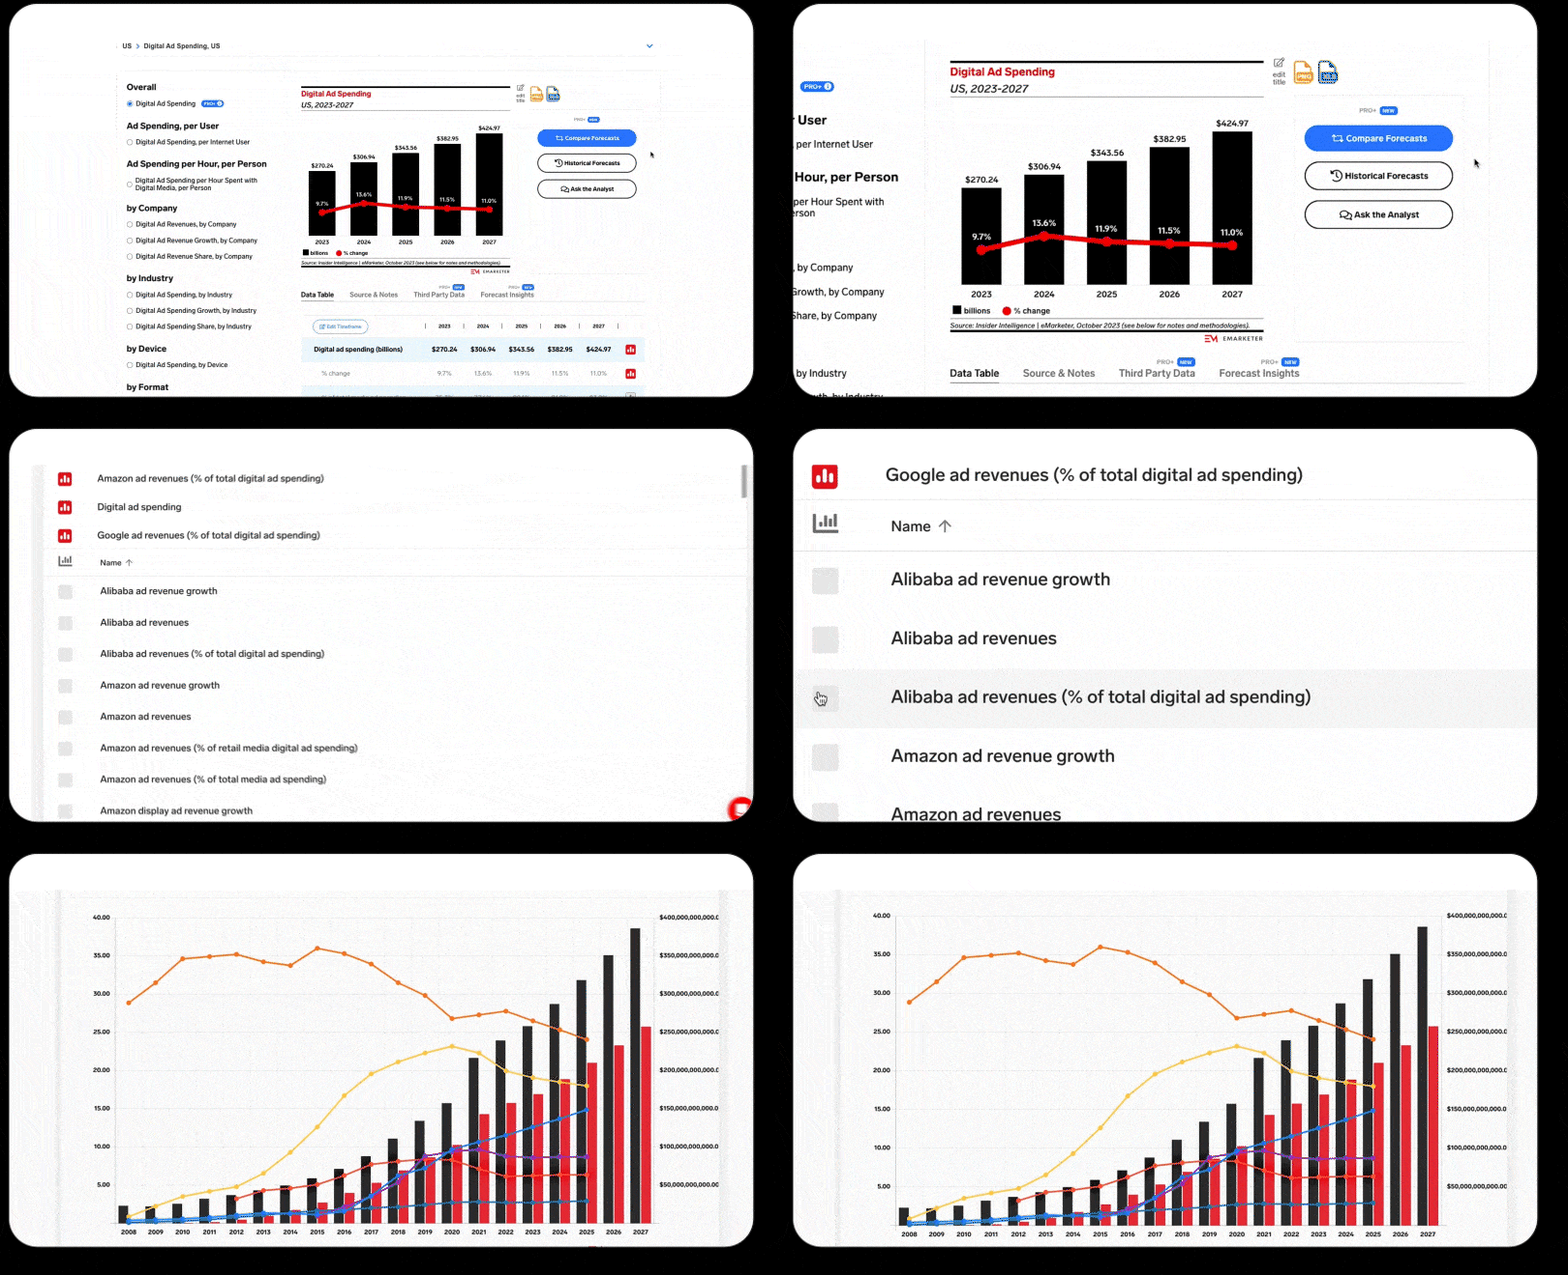
Generate your own charts comparing the forecast data that matters most to you. Compare multiple forecasts directly on the EMARKETER platform without needing to download data from various forecasts into another tool to merge the results.
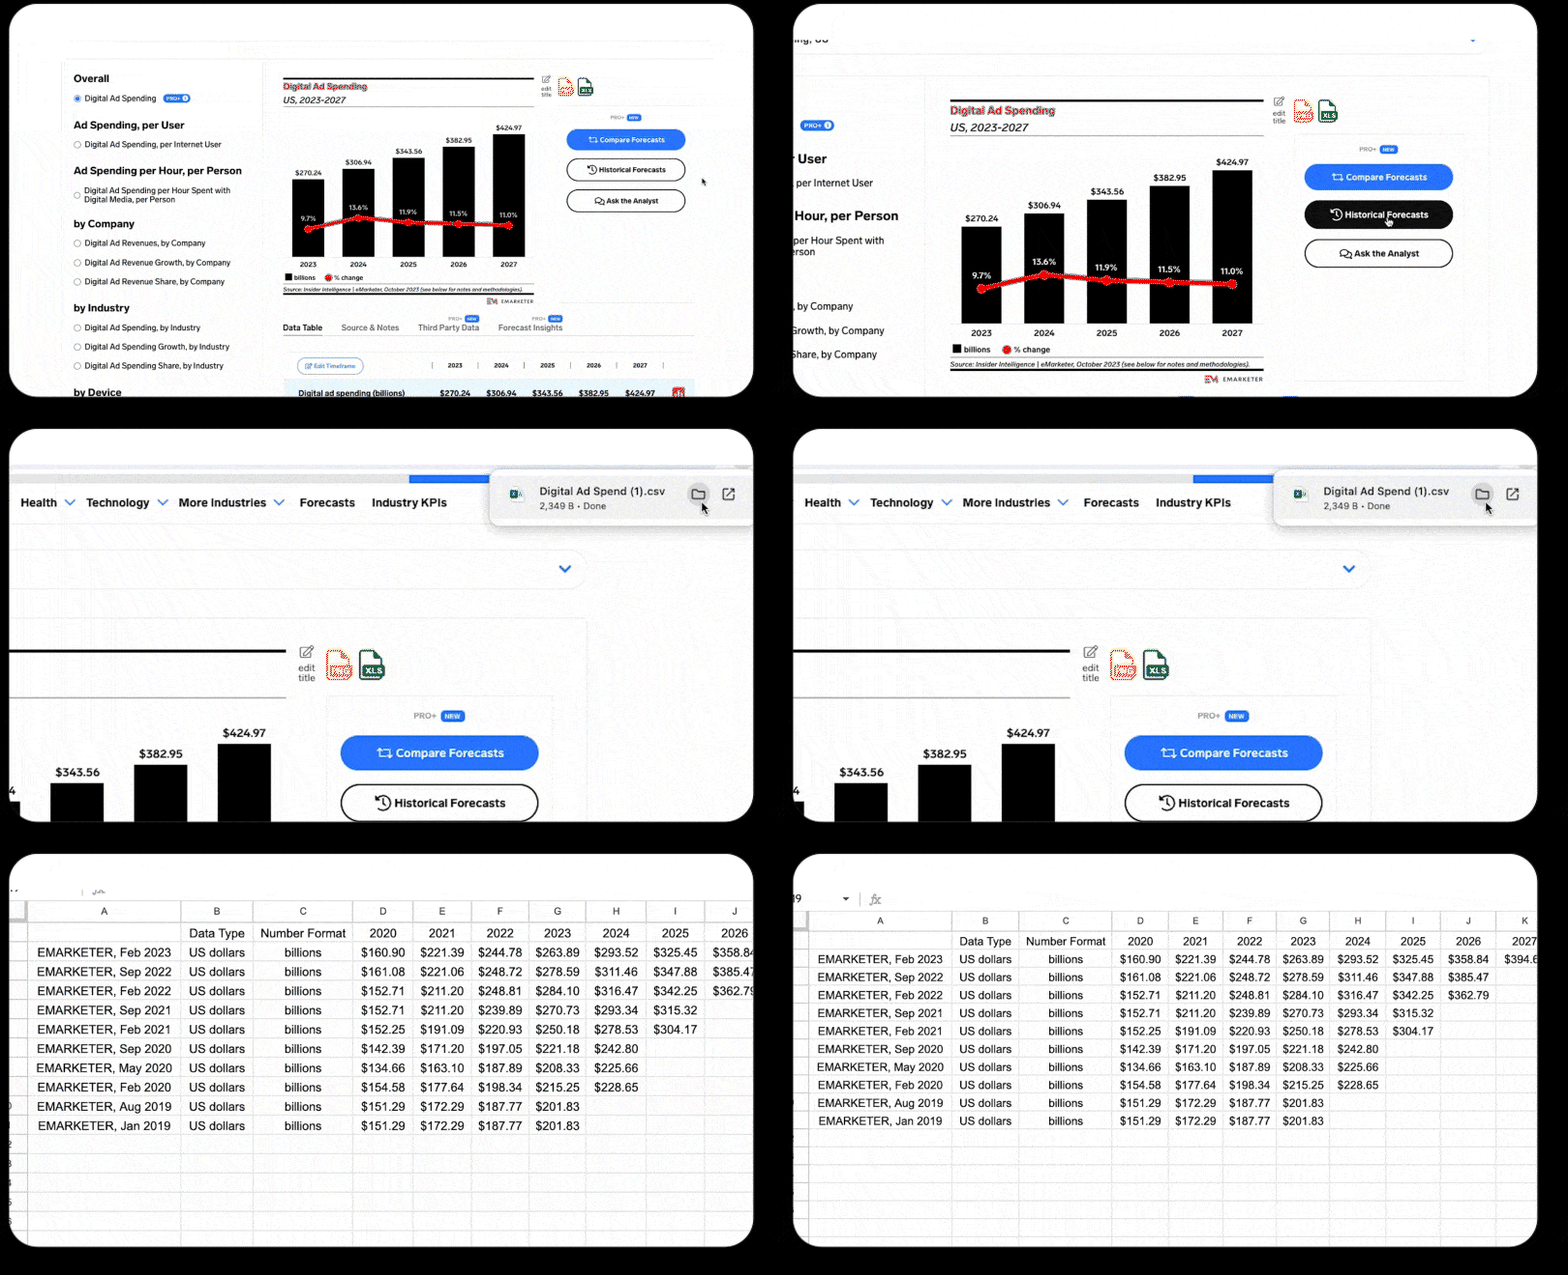
Leverage historical data to anticipate market events and measure their impact. See how our forecasts have changed over time to help identify patterns.
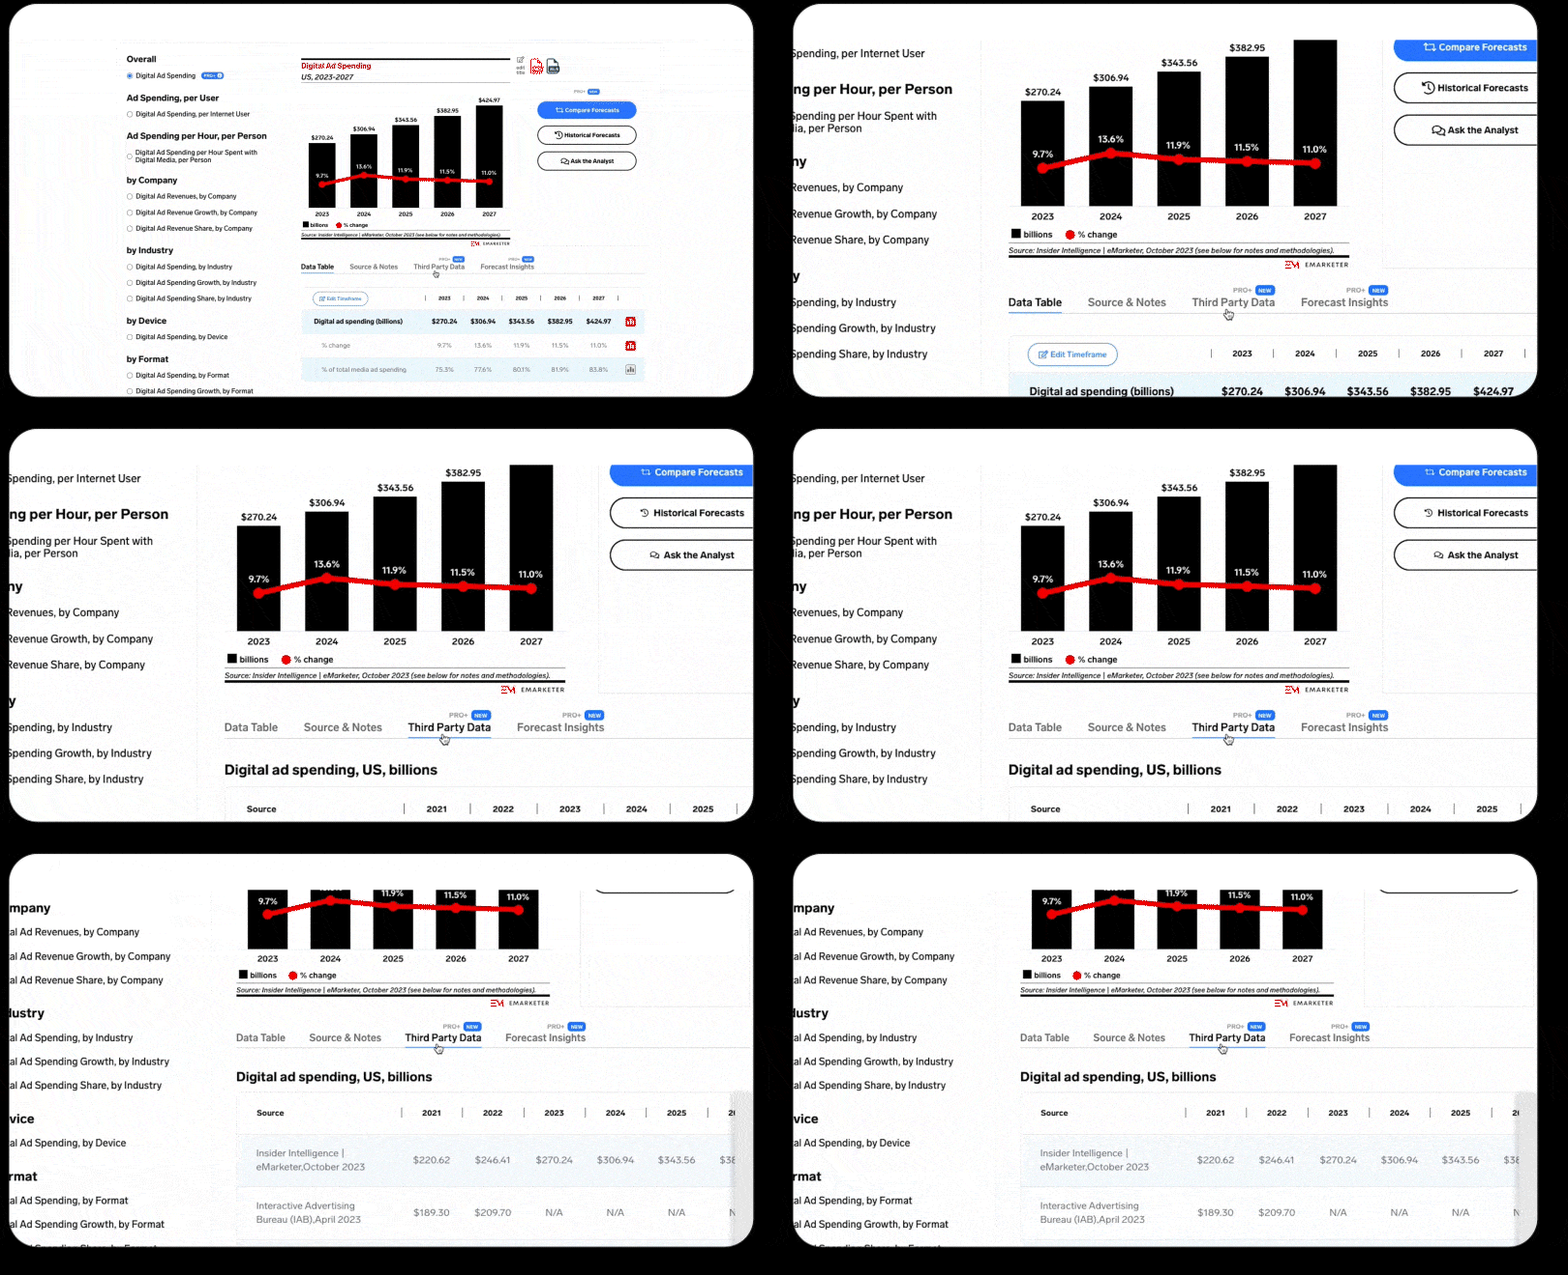
Spend less time searching for data and more time analyzing your forecasts. Listed third party data allows you to view EMARKETER forecasts against other companies’ forecasts in one place.
Dive deeper into the research with extra insights from our analysts. Forecast Insights provide additional expert background to help contextualize the projections. For additional questions, get in touch with our analysts through Ask the Analyst.
Stay up to date on the latest trends and exclusive EMARKETER insights.